 |
Experiment I: Introduction to Simulation of Packet-Switched NetworksAhmet Sekercioglu and Leon Seng |
Objectives
In this lab, we will make a start on learning the basics of discrete-event simulations, modeling packet generation processes, visualization and interpretation of simulation results.
Experiment
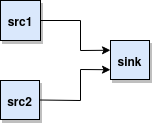
We will be using a model of two packet generators and a packet sink:

Part 1
The following Python script creates a model of two packet generators connected to a packet sink (the packet generator and sink models are provided in SimComponents.py).
from random import expovariate
import simpy
from SimComponents import PacketGenerator, PacketSink

def arrival_dist1():
    # Constant arrival distribution for generator 1
    return 1.5

def arrival_dist2():
    # Constant arrival distribution for generator 2
    return 2.0

def size_dist():
    # Exponential distribution of packet sizes for generators
    return expovariate(0.01)

def two_pk_generators():
    # Create the SimPy environment
    env = simpy.Environment()
    pk_sink = PacketSink(env, debug=True)  # Enable debugging for simple output
    pk_gen1 = PacketGenerator(env, "flow_1", arrival_dist1, size_dist)
    pk_gen2 = PacketGenerator(env, "flow_2", arrival_dist2, size_dist)

    # Connect packet generators to the sink
    pk_gen1.out = pk_sink
    pk_gen2.out = pk_sink

    env.run(until=20)

if __name__ == '__main__':
    two_pk_generators()
Go through the script and understand how the model is put together. You may also wish to have a look inside SimComponents.py to to find out more about the implementation of the simulated elements.
Now let's run our first discrete-event simulation script:
Download SimComponents.py into your working directory.
Start a gedit session, and copy and paste the contents of the above script in. Save the script, let's choose the filename as two_pk_generators.py.
We are ready to run it: python two_pk_generators.py
Answer the following questions:
Are the packet inter-arrival times constant?
Are the packet sizes constant?
Part 2
Write a new packet sink that displays the running average packet size from each packet source each time a packet is received. You will probably want to use SimComponents.PacketSink as a reference.
Once that has been completed, update the script by wiring the packet generators to your packet sink, and re-run the script.
Show the output to your lab demonstrator.
Part 3
Modify your script to get:
Average packet size from pk_gen1 is 300
Average packet size from pk_gen2 is 400
Hint: Read the documentation for Python's random.expovariate() function to help you with this.
Run your script to verify the results. Are the average packet sizes close to what you expect? How can you improve this?
Next, modify the script such that:
Packet sink now displays the average inter-arrival time of packets from a source each time a packet is received from that source.
pk_gen1 now sends packets with exponentially distributed inter-arrival times with a mean of 1.5
pk_gen2 now sends packets with exponentially distributed inter-arrival times with a mean of 2
Show the output to your lab demonstrator.
Part 4
Once the simulation has ended, plot a histogram of the packet inter-arrival times from packet generator pk_gen1 using Matplotlib's hist function. You may refer to this link for some help with the plotting.
Next, plot the following histograms in a single matplotlib figure window with a 2x2 arrangement (See matplotlib.pyplot.subplot()):
pk_gen1 packet inter-arrival times
pk_gen2 packet inter-arrival times
pk_gen1 packet sizes
pk_gen2 packet sizes
Remember to include axis labels in your plots.
Show the output to your lab demonstrator.
Your Report
After finishing your experiments, you will need to prepare a short (maximum two pages, 10 pt Times-Roman font) report summarizing the key points you have learned in this exercise.
Please convert your report to PDF (no other formats will be accepted), zip your report with all the Python code you have written for the experiment, and upload all as a single zip file to the unit's Moodle site before the due date (we will post the deadlines at the unit's Moodle site).
References
G. Bernstein, Basic Network Simulations and Beyond in Python
