 |
Experiment 4: Modeling Packet-Switched Networks as Networks of QueuesAhmet Sekercioglu and Leon Seng |
Objectives
In this experiment, we will learn how packet-switched networks could be modeled as networks of queues by using discrete event simulation techniques. We will record the end-to-end packet delays under varying offered load conditions to compare them later with theoretical analysis results.
Experiment
Part 1
The script q_net.py models a small packet-switched network. By going through the script, draw a diagram of the network modeled (like the diagram shown below in the second part of the experiment). It uses SimComponents.py models that you are now familiar with (we used them in the previous experiment). Dr. Bernstein's Web site Basic Network Simulations and Beyond in Python has quite useful information about the models. We think that the comment blocks included in the SimComponents.py file contain important information as well.
Run the model to see how things work. Change the packet generator parameters to see how packet delays are affected. Once you understand how the model is built, you can proceed to Part 2 below.
Do not forget to show the diagram to your lab demonstrator.
Part 2
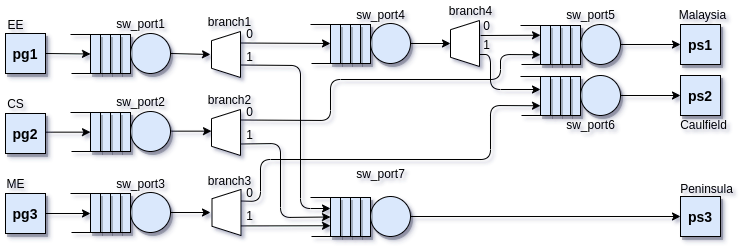
We have created a simplifed engineering faculty (our fictitious faculty has three departments only) computer network diagram as a queueing network. The diagram is shown below:

By using the q_net.py as your starting point, write your simulation script to model the above queueing network. We know the following:
Average packet sizes are 500 bytes, and exponentially distributed,
We assume that the traffic generated by the LANs are Poisson,
All links are 100 Mbits/sec switched Ethernet,
70% of the traffic generated by the EE LAN is destined to Malaysia and Caulfield Campuses (in aggregate). Then, the split is 65% and 35% for Malaysia and Caulfield respectively,
40% of the traffic generated by CS LAN goes to Malaysia Campus, and
55% of the traffic generated by ME LAN finds its way to Peninsula Campus.
For the offered link loads of 10%, 20% and 30% of the Ethernet link capacities (i.e. 100 Mbits/sec) at the departmental LANs (packet generators), run your simulation for 5000 seconds to collect and record the following statistics in a table:
End-to-end average packet delay for pg1 to ps1, pg1 to ps2 and pg1 to ps3,
End-to-end average packet delay for pg2 to ps1 and pg1 to ps3, and
End-to-end average packet delay for pg3 to ps2 and pg3 to ps3.
Show the results to your lab demonstrator.
Your Report
After finishing your experiments, you will need to prepare a short (maximum two pages, 10 pt Times-Roman font) report summarizing the key points you have learned in this exercise.
Please convert your report to PDF (no other formats will be accepted), zip your report with all the Python code you have written for the experiment, and upload all as a single zip file to the unit's Moodle site before the due date (we will post the deadlines at the unit's Moodle site).
References
G. Bernstein, Basic Network Simulations and Beyond in Python
